What is the scale of recycling?
The above statistical pie graph, created by Planet Ark in 2012 shows percentage of Australian waste that comes from construction and Demolition, commercial and Industrial and Municipal area. It also shows the percentage of that waste that is recycled or sent to landfill.
It is clear that each section of waste contributes to about one third of the overall waste in Australia, with Construction and Demolition having slightly more and Municipal solid waste having slightly less. In the Municipal Solid waste sector only about two fifths of the waste is recycled and the remaining three fifths is sent to landfill. In the Commercial and Industrial waste sector slightly over half of the waste is recycled, which is much better than the Municipal solid waste sector. In the Construction and Demolition waste sector more than half of or the waste is recycled which is just as good as the Commercial and Industrial sector. Overall about half of the waste in Australia is recycled.
It is clear from these statistics that recycling has improved since 2003 (when Australia was only recycling 30.3% of waste) but we still have a log way to go in the future.
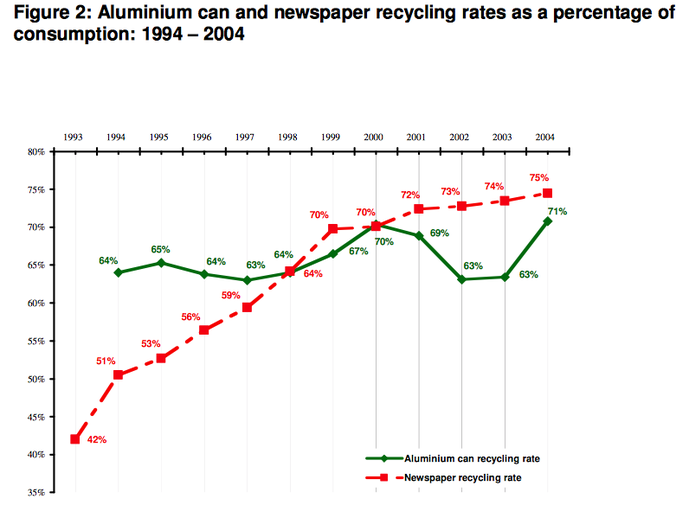
This Graph compares the recycling rate of aluminium cans and newspapers from 1993 to 2004. It was by Planet Ark in 2012 as part of National Recycling Week. You can clearly see that the rate of newspaper recycling has risen a dramatic 33% between 1993 and 2004. This is good news as it means that we are not wasting as many resources. Aluminium cans, on the other hand, started to rise until 2000, when the dropped down again. But in 2002 they started to rise and in 2004, 71% of aluminium cans were being recycled. Aluminium can recycling stays consistently around the mid sixties but reached a new peak of 71% in 2004. In these statistics you can see that it is likely for newspaper and aluminium can recycling to improve in the future.
|
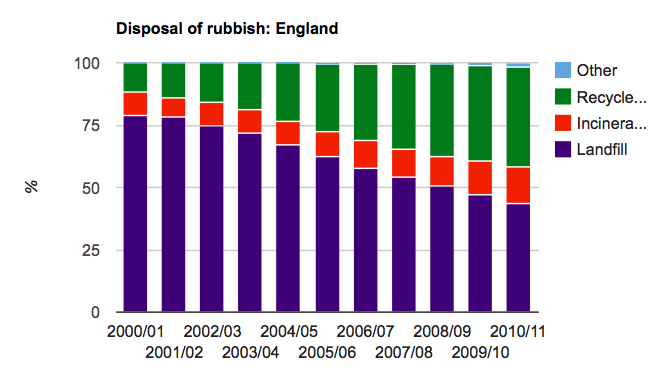
This graphical display of the disposal of rubbish in England between 2000 and 2010 was created by "The Guardian." It shows that the percentage of rubbish going into landfill decreased between 2000 and 2010. The amount of rubbish recycled increased hugely and the rate of incineration also increased, although not as much. There were also some other methods of garbage disposal that started in 2005 and grew in 2010. This decrease in landfill, from over 75% to under 50% and increase in recycling, from approximately 58% to 88% will be very good for the environment. If we continue this way we will become for sustainable in the future.
|
|